August 2017 Saint Cloud Weather Summary
Cool, Wet August Finishes Seasonable Summer
Saint Cloud Weather Summary for August 2017 and Summer 2017
Issued: Tuesday, September 12, 2017 7:35 AM
St. Cloud Misses 10 Coolest Augusts by 0.2 degree
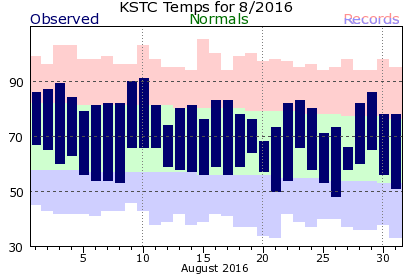
After a fairly warm July, conditions cooled drastically in August. The average temperature of the St. Cloud Regional Airport was 64.6°F, 3.2°F cooler than average. This ranks as the 11th coolest August in St. Cloud records, barely missing out on the 10 coolest Augusts by 0.2°F.
This marked a major change from the weather pattern in late July. The extreme heat over the Rockies actually backed up further to the west, affecting areas of the west right to near the coast. However, the northwest-to-southeast flow that developed pushed the hot and steamy air out of Minnesota, the Great Lakes, and the Northeast. There were only 4 days out of the 31 days in the month with an above average temperature. There were 4 days when the high temperature stayed below 70 degrees, including August 3 with a record cold high of 60 degrees. The average temperature on August 3 was only 55 degrees, breaking the record cool average of 55 degrees. There were 6 days with a high of 80 degrees with only one day of 85 degrees or warmer on August 1. Thus far this summer, St. Cloud has had only 2 days with a high of 90 degrees or warmer. On the other hand, Great Falls, Montana and Spokane, Washington have both had 32 days with a high of at least 90 degrees. (St. Cloud hasn't had that many days of 90 degrees since 1988 (33 days).
The cool August pulled the meteorological summer average temperature a bit below average at 67.0°F, 0.9°F below average.
Frequent August Rainfall in Most of Minnesota, Except Northwest
Some of the cooler than average August temperatures were the result of frequent showers and thunderstorms. There were 12 days with measurable rainfall, including 5 days with at least half an inch of rain. The St. Cloud total August rainfall was 5.27 inches, 1.48 inch above average. There was even more rainfall just to the west of St. Cloud in a northeast-southwest band from Brainerd and Aitkin through Long Prairie, Alexandria, Clara City, Graite Falls and Redwood Falls. Much of this area had over 8 inches of rain with over 12 inches in the middle Minnesota River Valley. On the other hand, the Red River Valley was much drier with an inch and a half or less, part of the dry conditions that have extended from northwestern Minnesota into Montana.
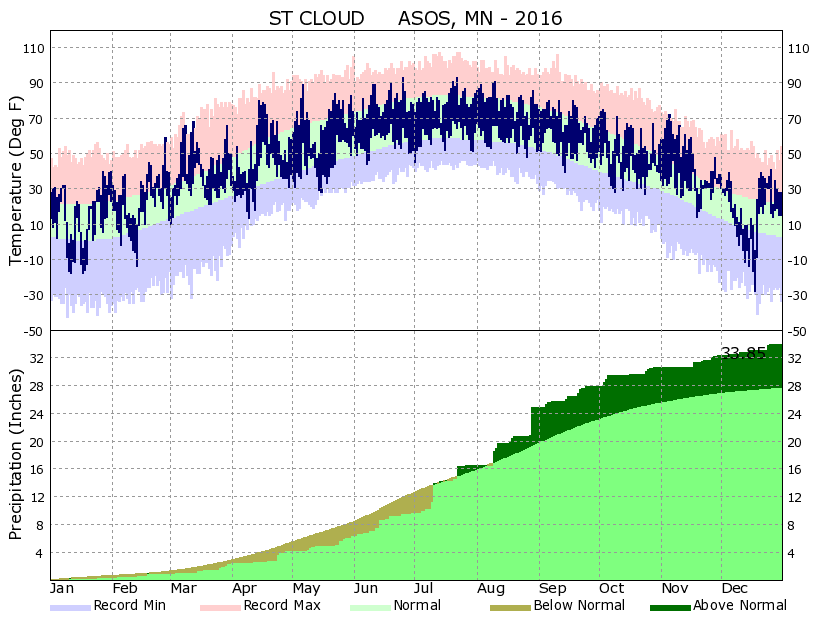
Over the course of the summer, St. Cloud has picked up nearly average rainfall. The June through August rainfall was 11.23 inches, 0.04 inch below average. For the growing season (April through August), St. Cloud has seen 18.94 inches, 2.75 inches above average. Rainfall for the growing season has been much higher to the north from Alexandria and Glenwood through Little Falls and Pierz and in the Minnesota River Valley.
Dryness to North and West Brought Frequent Smoke to Minnesota
The heat and dryness to the west have produced numerous fires from the Canadian Prairie Provinces into Washington, Oregon, and California. While this smoke hasn't produced the severe problems seen the second half of August from Washington and Oregon into Idaho and Montana, some of the smoke from these fires has pushed into Minnesota at times.
Storms Much of Mid-Month, Producing Severe Weather and Blocking View of Eclipse
Much of the August rain fell during the week of August 13-17. There was as much as 3 inches of rain in Glencoe and Montevideo. On August 16 and 17, there were 10 brief tornado touchdowns from Mankato to south central Minnesota and 5-7 inches of rain in the upper Minnesota Valley.
The frequent rainfall also spanned August 21, affecting a near total solar eclipse in central Minnesota. St. Cloud and other areas lost the opportunity to view the midday eclipse as those storms from western Minnesota moved through and blossomed during the middle of the day. Some sun was seen through the clouds in the Twin Cities.
The persistant northwest flow has given way in early September to warmer temperatures, getting the month off to a warm, but much drier start.
|
Temperatures (°F)
|
August 2017
|
Normal
|
|
| August 2017 Average High Temperature (°F) |
75.2
|
79.6
|
|
| August 2017 Average Low Temperature (°F) |
54.0
|
56.0
|
|
| August 2017 Mean Temperature for August (°F) |
64.6
|
67.8
|
|
|
August Extremes
|
Temperature(°F)
|
Date
|
|
| Warmest High Temperature for August 2017 (°F) |
86
|
August 1
|
|
| Coldest High Temperature for August 2017 (°F) |
60 (set record; see below)
|
August 3
|
|
| Warmest Low Temperature for August 2017 (°F) |
62
|
August 16
|
|
| Coldest Low Temperature for August 2017 (°F) |
47
|
August 23
|
|
|
Record Temperatures in August 2017
|
Temperature(°F)
|
Date
|
Old Record
|
| Daily Record Cold High |
60°F
|
August 3
|
62°F in 1974
|
| Daily Record Average High |
55°F
|
August 3
|
56°F in 1915
|
|
Temperature Thresholds
|
Number of Days
|
Normal
|
|
| August 2017 Days with High Temperatures >= 100°F |
0
|
0.06
|
|
|
2017 Total Days with High Temperature of At Least 100°F Last 100°F High: June 7, 2011 (101°F) |
0
|
0.51
|
|
| August 2017 Days with High Temperatures >= 90°F |
0
|
3.13
|
|
| 2017 Total Days with High Temperature of At Least 90°F |
2
|
11.43
|
|
| August 2017 Days with Low Temperatures >= 70°F |
0
|
0.68
|
|
| 2017 Total Days with Days with Low Temperatures >= 70°F |
0
|
3.00
|
|
| August 2017 Days with Low Temperatures >= 75°F |
0
|
0.07
|
|
|
2017 Total Days with Days with Low Temperatures >= 75°F Last 75°F Low: July 4, 2012 (76°F) |
0
|
0.47
|
|
|
Precipitation (in)
|
August 2016
|
Normal
|
|
|
August 2017 Rainfall (in)
|
5.27
|
3.79
|
|
|
August Extremes
|
Precipitation (in)
|
Date
|
|
|
Most Daily Precipitation in August 2017
|
1.45 inch
|
August 3
|
|
|
Record Precipitation in August 2017
|
Precipitation (in)
|
Date
|
Old Record
|
|
No records set
|
|||
|
Precipitation Thresholds
|
Number of Days
|
Normal
|
|
| August 2017 Days with Measurable (>= 0.01 inch) Precipitation |
12
|
9.0
|
|
| August 2017 Days with >= 0.10 inch Precipitation |
8
|
5.6
|
|
| August 2017 Days with >= 0.25 inch Precipitation |
6
|
3.9
|
|
| August 2017 Days with >= 0.50 inch Precipitation |
5
|
2.4
|
|
| August 2017 Days with >= 1.00 inch Precipitation |
2
|
1.0
|
|
Summer (June 1-August 31) 2017 Statistics
|
Temperatures (°F)
|
Summer 2017
|
Normal
|
| Summer 2017 Average High Temperature (°F) |
78.9
|
79.8
|
| Summer 2017 Average Low Temperature (°F) |
55.0
|
56.0
|
| Summer 2017 Mean Temperature for Summer (°F) |
67.0
|
67.9
|
|
Temperature Thresholds
|
Number of Days
|
Normal
|
| Summer 2017 Days with High Temperatures >= 100°F |
0
|
0.51
|
| Summer 2017 Days with High Temperatures >= 90°F |
2
|
11.27
|
| Warm Season 2017 Days with High Temperatures >= 90°F |
2
|
11.44
|
| Summer 2017 Days with Low Temperatures >= 70°F |
0
|
2.81
|
| Warm Season 2017 Days with Low Temperatures >= 70°F |
0
|
3.02
|
| Summer 2017 Days with Low Temperatures >= 75°F |
0
|
0.47
|
|
|
Link to Table of Top 10 Warmest/Coldest Summers | |
|
Precipitation (in)
|
Summer 2017
|
Normal
|
|
Summer 2017 Rainfall (in)
|
11.23 ( -0.04 from average)
|
11.27
|
|
2017 Growing Season (April 1- August 31) Rainfall (in)
|
18.94 ( +2.75 from average)
|
16.19
|
|
2017 Total Precipitation (in) (January 1 - August 31)
|
20.93 ( +1.35 from average)
|
19.58
|
|
Precipitation Thresholds
|
Number of Days
|
Normal
|
| Summer 2017 Days with Measurable (>= 0.01 inch) Precipitation |
33
|
29.1
|
| Total 2017 Days with Measurable (>= 0.01 inch) Precipitation |
74
|
68.2
(Annual Normal: 97.3) |
| Summer 2017 Days with >= 0.10 inch Precipitation |
20
|
18.9
|
| Total 2017 Days with >= 0.10 inch Precipitation |
42
|
38.1
(Annual Normal: 52.9) |
| Summer 2017 Days with >= 0.25 inch Precipitation |
15
|
13.1
|
| Total 2017 Days with >= 0.25 inch Precipitation |
30
|
24.0
(Annual Normal: 32.1) |
| Summer 2017 Days with >= 0.50 inch Precipitation |
9
|
7.8
|
| Total 2017 Days with >= 0.50 inch Precipitation |
14
|
12.7
(Annual Normal: 16.8) |
| Summer 2017 Days with >= 1.00 inch Precipitation |
3
|
3.1
|
| Total 2017 Days with >= 1.00 inch Precipitation |
4
|
4.1
(Annual Normal: 5.5) |


Send comments to: raweisman@stcloudstate.edu