August and Summer 2024 Saint Cloud Weather Summary
|
|
||||||
| Minnesota Rainfall |
(set day to August 24 and time to Year to Date) |
|||||
| Severe Weather | August 5 Minnesota DNR report | August 26 and 27 from Minnesota DNR | ||||
Wet, Severe, Warm August Produces More Records and Milestones
Saint Cloud Weather Summary for August 2024 and Summer 2024
Much of the St. Cloud, MN, warm season has been wet and abnormally humid. August 2024 provided a major mid-month break (August 5-13) in the warmth and humidity, but both the beginning and end of the month pushed the month to abnormally wet and warm levels.In addition, August ended up producing more severe weather than any other previous month.
More than One and a Half Times Average Rainfall, Including August 5 Record
The August 2024 St. Cloud rainfall totaled 6.21 inches, nearly two and a half inches above average. That made August 24 the 15th wettest August since 1887 (average rain: 4.00 inch). For the second straight month, St. Cloud had a daily rainfall total of more than 2 inches with 2.81 inch on August 5. This was also a record rainfall for the date (old record: 1.95 inch in 1900). Between August 8 and 21 was one of driest periods of the entire year with only 2 days of measurable rainfall out of the 14 days. However, there were three days with more than half an inch of rain in the final 10 days of the month.
Top 10 Wet Meteorological Summer
For the meteorological summer (June 1-August 31), the St. Cloud rainfall was 16.52 inches, 5.17 inches above average and 10th wettest summer among the 137 summers in St. Cloud records.
Especially Wet in Central Minnesota Since April
Much of the state has shared in the heavy rainfall with a large portion of central Minnesota from Alexandria and Glenwood through Pine City, Hinckley, and northern half of the Twin Cities over 6 inches (see NWS Water Prediction Service August Minnesota Rainfall red) Only parts of northwestern, interior north central Minnesota had less than 2 inches. For the three summer months, the NWS Water Prediction Service Summer Minnesota Rainfall map (set date to August 31 and time to last 90 days) shows much of central and eastern central Minnesota from Duluth to Staples to Granite Falls to Hastings plus southwestern Minnesota over 15 inches of rain with most of southern half of Twin Cities over 20 inches. On the other hand, the Red Lakes areas (green) has seen less than 8 inches and the northern part of the Arrowhead has seen only seasonal rainfall. This is also shown in the latest summary of Growing Season Rainfall (since April). That's why the latest measurements from the Minnesota Department of Natural Resources show river and stream flow in highest 25 percent
5th Wettest Jan-Aug, 2nd Wettest Dec-Aug
For the year through August (set day to August 31 and time to year to date on the 2024 Minnesota rainfall), all of southern Minnesota, central and east central Minnesota to the northeast are mainly above 25 inches of rain. In fact, most of central and east central Minnesota are over 30 inches of rain. Specifically in St. Cloud, the 29.11 inches from January through August is 29.11 inches, 7.49 inches above average, and the 5th wettest January through August period (see table below). Two relatively recent years, 2014 (29.37 inches) and 1990 (29.28 inches), rank ahead of 2024. However, 2019 is St. Cloud's rainiest year on record with 41.92 inches, even though it only ranks 8th in the January through August total. The last 4 months of 2019 produced another 14.58 inches, including 11.39 inches in September and October.
Throw in the record wet December 2023 and the 9-month St. Cloud precipitation total is 32.46 inches, ranking behind only the 34.26 inches of 1897 (see table below).
|
St. Cloud Spring-Summer Rainy Periods
|
|||||
| January-August (avg 20.62 in) | December to August (avg 21.50 in) | ||||
| Rank | Rainfall (in) | Year | Rank | Rainfall (in) | Years |
| 1 | 34.26 | 1897 | 1 | 34.26 | 1896-1897 |
| 2 | 30.78 | 1965 | 2 | 32.46 | 2023-2024 |
| 3 | 29.37 | 2014 | 3 | 31.36 | 1964-1965 |
| 4 | 29.28 | 1990 | 4 | 31.14 | 2013-2014 |
| 5 | 29.11 | 2024 | 5 | 29.98 | 1950-1951 |
| 6 | 28.77 | 1905 | 6 | 29.61 | 1989-1990 |
| 7 | 28.18 | 1951 | 7 | 29.16 | 1904-1905 |
| 8 | 27.34 | 2019 | 8 | 28.34 | 1902-1903 |
| 9 | 27.33 | 1986 | 9 | 28.25 | 1951-1952 |
| 10 | 26.91 | 1903 | 10 | 28.23 | 2018-2019 |
The frequency of rain in all amounts of at least 0.10 inch or more has nearly reached the averages for the entire year:
- 52 days with at least 0.10 inch (annual average 52.9)
- 32 days with at least 0.25 inch (annual average 32.1)
- 20 days with at least 0.50 inch (annual average 16.8)
- 7 days with at least 1 inch (annual average 5.5)
The only exception is measurable precipitation days (at least 0.01 inch). There have been 77 days so far, above the Jan-Aug average of 69.2 days, but still short of the 97.3 annual average. During the first 3 months of the year, precipitation was above average, but relatively infrequent.
August Severe Weather Included Large Hail, Melrose Tornado, State Fair Derecho
The frequent rainfall was often produced through extraordinarily humid air. These storms delivered more severe weather (aside from flooding) to Minnesota of any month. The August 3 outbreak was notable for a tornado that hit the western portion of Melrose. The tornado was rated EF-1 with estimated top winds of 95 MPH. There were also reports of hail up to 3 inches in diameter and winds up to 65 MPH in Little Falls.
Other severe weather outbreaks included
- August 5: Southern Minnesota Tornadoes ( Minnesota DNR report)
- August 26: Extreme Heat and Severe Storms (Minnesota DNR) including State Fair area derecho (outbreak of straight line damaging wind extending into Upper Michigan)
- Note that the report of middle 80's dew points in places like Preston were recorded at gauges that tend to be too moist, so the reading of 86 will not go down as the second highest dew point in Minnesota records.
- August 29: 3 Tornadoes and Wind Damage (Willmar and western Twin Cities)
Warm, But Not in the Expected Way
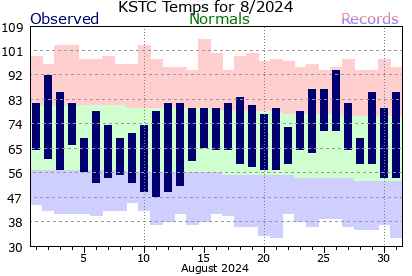
Temperature-wise, St. Cloud continued the warmer than average trend that began in May 2023 (see discussion in July 2024 St. Cloud weather summary), but has been rarely extreme through the summer. The average August temperature was 69.9°F, 2.2°F warmer than average. This merely ranks as the 41st warmest August since 1893. While the average high of 80.3°F was only 1.1°F above average, the average low was 59.5°F, 3.2°F above average, the 15th warmest average low and the warmest since 2014. This was also seen in having only 2 days warmer than 90 degrees, August 2 (92) and August 26 (94), the latter being the warmest day of the year. There have only been 6 days with a high of least 90 degrees, well below the average of 11.2 days. The bottom table in this report shows the relatively few days with extreme high temperatures in St. Cloud since the summer of 1988. In the past 26 years, St. Cloud has only made it to 97 degrees or hotter 28 times, an average of about once a year. That compares to 13 days in 1988, 7 of which topped 100 degrees. There have been only 4 days reaching 100 degrees since 1988.
Over the entire meteorological summer, the average St. Cloud temperature was 70.0°F, 37th warmest on record. Again, the 80.6°F average high was unremarkable (53rd warmest), but the 59.3°F low was 14th warmest. This was the warmest summer low temperature since 1955.
Warm Lows (Warmest since 1955) Sign of Persistently High Dew Points
There are no long term records of dew point in St. Cloud, since there were only daytime readings before the station was automated in 1995. However, summer low temperature is affected by the dew point, along with other factors like clouds and wind. Usually, the low temperature gets pretty close to the dew point, unless the winds remain up all night. So, having an usually warm average low temperature this summer is a sign that the dew points were very warm as well. So, while we haven't been hot very often, the persistently high dew points have been one side effect of the wet weather. 34 of the 62 July and August nights had lows of 60 degrees or warmer. If that was the dew point, it was at a level that Minnesotans would label uncomfortable.
|
|
||||||
| Minnesota Rainfall |
(set day to August 24 and time to Year to Date) |
|||||
| Severe Weather | August 5 Minnesota DNR report | August 26 and 27 from Minnesota DNR | ||||
|
Temperatures (°F)
|
August 2024
|
Normal
|
|
| August 2024 Average High Temperature (°F) |
80.3
|
79.2
|
|
| August 2024 Average Low Temperature (°F) |
59.5
|
56.3
|
|
| August 2024 Mean Temperature for August (°F) |
69.9
|
67.7
|
|
|
August Extremes
|
Temperature(°F)
|
Date
|
|
| Warmest High Temperature for August 2024 (°F) |
94
|
August 26
|
|
| Coldest High Temperature for August 2024 (°F) |
69
|
August 5,8, 28
|
|
| Warmest Low Temperature for August 2024 (°F) |
72
|
August 25, 26
|
|
| Coldest Low Temperature for August 2024 (°F) |
48
|
August 11
|
|
|
Record Temperatures in August 2024
|
Temperature(°F)
|
Date
|
Old Record
|
| No Daily Records Set | |||
|
Temperature Thresholds
|
Number of Days
|
Normal
|
|
| August 2024 Days with High Temperatures >= 100°F |
0
|
0.06
|
|
|
2024 Total Days with High Temperature of At Least 100°F |
0
|
0.51
|
|
| August 2024 Days with High Temperatures >= 90°F |
2
|
3.13
|
|
| 2024 Total Days with High Temperature of At Least 90°F |
6
|
11.43
|
|
| August 2024 Days with Low Temperatures >= 70°F |
2
|
0.68
|
|
| 2024 Total Days with Days with Low Temperatures >= 70°F |
3
|
3.00
|
|
| August 2024 Days with Low Temperatures >= 75°F |
0
|
0.07
|
|
|
2024 Total Days with Days with Low Temperatures >= 75°F Last 75°F Low: July 4, 2012 (76°F) |
0
|
0.47
|
|
|
Precipitation (in)
|
August 2024
|
Normal
|
|
|
August 2024 Rainfall (in)
|
6.21 (15th wettest)
|
4.00
|
|
|
August Extremes
|
Precipitation (in)
|
Date
|
|
|
Most Daily Precipitation in August 2024
|
2.81 inch (broke record; see below)
|
August 5
|
|
|
Record Precipitation in August 2024
|
Precipitation (in)
|
Date
|
Old Record
|
| Daily Record Rainfall |
2.81 inches
|
August 5
|
1.95 inch in 1900
|
|
Precipitation Thresholds
|
Number of Days
|
Normal
|
|
| August 2024 Days with Measurable (>= 0.01 inch) Precipitation |
10
|
9.0
|
|
| August 2024 Days with >= 0.10 inch Precipitation |
9
|
5.6
|
|
| August 2024 Days with >= 0.25 inch Precipitation |
6
|
3.9
|
|
| August 2024 Days with >= 0.50 inch Precipitation |
4
|
2.4
|
|
| August 2024 Days with >= 1.00 inch Precipitation |
1
|
1.0
|
|
|
|
||||||
| Minnesota Rainfall |
(set day to August 24 and time to Year to Date) |
|||||
| Severe Weather | August 5 Minnesota DNR report | August 26 and 27 from Minnesota DNR | ||||
Summer (June 1-August 31) 2024 Statistics
|
Temperatures (°F)
|
Summer 2024
|
Normal
|
| Summer 2024 Average High Temperature (°F) |
80.7 (53rd warmest high)
|
79.3
|
| Summer 2024 Average Low Temperature (°F) |
59.3 (14th warmest low)
|
56.7
|
| Summer 2024 Mean Temperature for Summer (°F) |
70.0 (37th warmest)
|
68.0
|
|
Temperature Thresholds
|
Number of Days
|
Normal
|
| Summer 2024 Days with High Temperatures >= 100°F |
0
|
0.51
|
| Summer 2024 Days with High Temperatures >= 90°F |
6
|
11.27
|
| Summer 2024 Days with Low Temperatures >= 70°F |
3
|
2.81
|
|
|
Link to Table of Top 10 Warmest/Coldest Summers | |
|
Precipitation (in)
|
Summer 2024
|
Normal
|
|
Summer 2024 (June 1-August 31) Rainfall (in)
|
11.35
|
|
|
December 2023-August 2024 Total Precipitation (in)
|
32.46 (+10.96 from average; 2nd wettest Dec-Aug)
|
21.50
|
|
2024 Total Precipitation (in) (January 1 - August 31)
|
29.11 (+8.49 from average; 5th wettest Jan-Aug)
|
20.62
|
|
Precipitation Thresholds
|
Number of Days
|
Normal
|
| Summer 2024 Days with Measurable (>= 0.01 inch) Precipitation |
39
|
29.1
|
| Total 2024 Days with Measurable (>= 0.01 inch) Precipitation |
77
|
68.2
(Annual Normal: 97.3) |
| Summer 2024 Days with >= 0.10 inch Precipitation |
27
|
18.9
|
| Total 2024 Days with >= 0.10 inch Precipitation |
52
|
38.1
(Annual Normal: 52.9) |
| Summer 2024 Days with >= 0.25 inch Precipitation |
10
|
13.1
|
| Total 2024 Days with >= 0.25 inch Precipitation |
24
|
24.0
(Annual Normal: 32.1) |
| Summer 2024 Days with >= 0.50 inch Precipitation |
10
|
7.8
|
| Total 2024 Days with >= 0.50 inch Precipitation |
20
|
12.7
(Annual Normal: 16.8) |
| Summer 2024 Days with >= 1.00 inch Precipitation |
4
|
3.1
|
| Total 2024 Days with >= 1.00 inch Precipitation |
7
|
4.1
(Annual Normal: 5.5) |
|
|
||||||
| Minnesota Rainfall |
(set day to August 24 and time to Year to Date) |
|||||
| Severe Weather | August 5 Minnesota DNR report | August 26 and 27 from Minnesota DNR | ||||
|
Year
|
Hottest High (°F)
|
Date
|
Days with High >= 97°F
|
|
1988
|
102°F
|
June 24, July 31
|
13
(7 days with >= 100°F) |
|
1989
|
98°F
|
August 4
|
1
|
|
1990
|
101°F
|
July 3
|
1
|
|
1991
|
95°F
|
July 18
|
0
|
|
1992
|
92°F
|
June 12, August 9
|
0
|
|
1993
|
90°F
|
August 10
|
0
|
|
1994
|
95°F
|
June 14
|
0
|
|
1995
|
97°F
|
June 17, July 13
|
2
|
|
1996
|
96°F
|
June 28
|
0
|
|
1997
|
95°F
|
June 23
|
0
|
|
1998
|
94°F
|
May 18
|
0
|
|
1999
|
98°F
|
July 30
|
2
|
|
2000
|
94°F
|
June 9
|
0
|
|
2001
|
98°F
|
August 6, 7
|
4
|
|
2002
|
95°F
|
June 30, July 6
|
0
|
|
2003
|
96°F
|
August 24
|
0
|
|
2004
|
96°F
|
June 30
|
0
|
|
2005
|
98°F
|
June 23
|
1
|
|
2006
|
101°F
|
July 31
|
5
|
|
2007
|
96°F
|
August 10
|
0
|
|
2008
|
91°F
|
June 6, 11, August 18
|
0
|
|
2009
|
92°F
|
May 20
|
0
|
|
2010
|
94°F
|
May 24
|
0
|
|
2011
|
101°F
|
June 7
|
1
|
|
2012
|
94°F
|
May 18
|
0
|
|
2013
|
95°F
|
May 14, Aug 26
|
0
|
|
2014
|
94°F
|
July 21
|
0
|
|
2015
|
91°F
|
August 14
|
0
|
|
2016
|
93°F
|
June 25, July 22
|
0
|
|
2017
|
92°F
|
June 10, July 17
|
0
|
|
2018
|
97°F
|
June 29
|
1
|
|
2019
|
92°F
|
July 15
|
0
|
|
2020
|
96°F
|
June 8
|
0
|
|
2021
|
98°F
|
June 5
|
2
|
|
2022
|
101°F
|
June 14
|
2
|
|
2023
|
97°F
|
August 22
|
1
|
|
2024
|
94°F
|
August 26
|
0
|
|
|
||||||
| Minnesota Rainfall |
(set day to August 24 and time to Year to Date) |
|||||
| Severe Weather | August 5 Minnesota DNR report | August 26 and 27 from Minnesota DNR | ||||
Updated: September 1, 2024


Send comments to: raweisman@stcloudstate.edu