February 2025 and Winter 2024-2025 St. Cloud Weather Summary
February Snaps 21-Month Long Mild Streak
February 2025 and Winter 2024-2025 Saint Cloud, MN, Weather Summary
Note: This is a summary of meteorological winter, which is defined as the three coldest months of the year (1 December through 29 February). Astronomical winter ends on the spring equinox, which will be on March 20 this year. That's the day when we get back to 12 hours of daylight. Also, note that the cold season can be used to refer to the part of the year when Minnesota can get snow (typically Oct-Apr, but can be longer) or the heating season (July 1-June 30). No, the groundhog doesn't work in Minnesota.
Fatter Filling of February Ice Sandwich
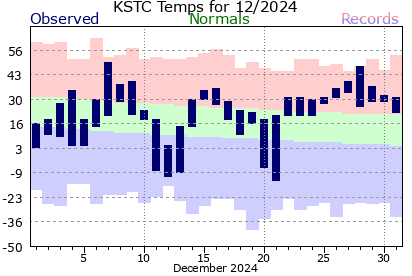
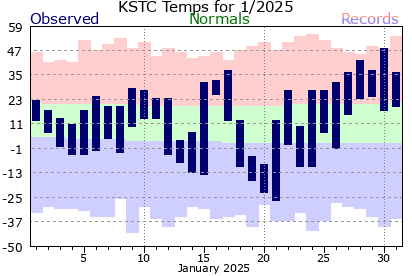
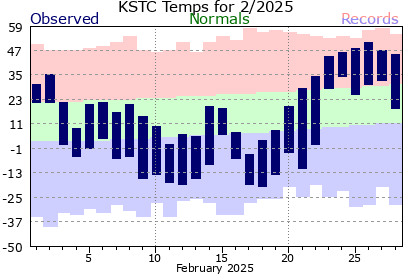
Each of Minnesota's three winter months during 2024-2025 has been an 'ice sandwich:' middle month outbreaks of cold air surrounded by near average or above average temperatures early in the month and a major thaw at the end of each month. The cold periods in December (a couple of 2-3 day periods) and in mid-January (8 out of 10 days) were not long or intense enough (despite two consecutive days of sub-zero high temperatures and two days of -20 low temperatures in mid-January) to keep the average monthly temperature colder than normal (see table below). However, a more persistent cold period in mid-February (16 of 18 days with a sub-zero low February 4-21; another day completely below zero on February 17, another -20 low on February 18) managed to build up a 10.3 degrees colder than average through February 21. The subsequent thaw removed all of the 13.1 inches of February snow, but only closed the gap to 3.8 degrees colder than average (12.3 degree average temperature; 22.9 degree average high, 1.7 degree average low). This ranked merely as the 64th coldest February of the 144 Februaries in St. Cloud records. But, it was our first colder than average month since April 2023. Both March and April 2023 were colder than average because of the tail end of St. Cloud's snowiest cold season on record.
|
Jan
|
Feb
|
Mar
|
Apr
|
May
|
June
|
July
|
Aug
|
Sept
|
Oct
|
Nov
|
Dec
|
Yr Avg
|
|
| 2023 Monthly Average Temperatures (°F) |
17.2
|
16.1 | 23.7 | 40.9 | 62.5 | 71.5 | 70.4 | 70.6 | 65.6 | 49.4 | 35.3 | 32.1 | 46.2 |
| Departure from Average (°F) |
+5.4
|
0.0 | -5.5 | -2.4 | +6.3 | +5.5 | +0.1 | +2.9 | +6.1 | +3.7 | +4.4 | +14.3 | +3.2 |
| 2024 Monthly Average Temperatures (°F) |
19.4
|
30.4 | 34.1 | 47.4 | 60.2 | 67.3 | 72.7 | 69.9 | 67.0 | 52.9 | 35.7 | 22.2 | 48.3 |
| Departure from Average (°F) |
+7.6
|
+14.3
|
+4.9
|
+4.1
|
+4.0 | +1.3 |
+2.4
|
+2.2 | +7.5 | +7.2 | +4.8 | +4.4 | +5.4 |
| 2025 Monthly Average Temperatures (°F) | 12.4 | 12.3 | |||||||||||
| Departure from Average (°F) | +0.6 | -3.8 | |||||||||||
| 30-Year Average (1991-2020) | 11.8 | 16.1 | 29.2 | 43.3 | 56.2 | 66.0 | 70.3 | 67.7 | 59.5 | 45.7 | 30.9 | 17.8 | 42.9 |
February was not cold enough to produce the forecast colder-than-average winter in Minnesota. The meteorological winter average temperature was 15.6 degrees, 0.4 degrees milder than average. That ranks as St. Cloud's 42nd mildest winter of 144 on record.
The mid-month cold periods set some extremes that hadn't been seen due to the extremely mild 2023-2024 and the snowy, but still relatively mild 2022-2023. The two consecutive zero or colder highs was the longest period below zero since merely Jan. 14-15, 2024 (yes, there were about 9 cold days during the mild 2023-2024 cold season). The three total days of zero or colder highs approached the 4.3 day average sub-zero days in a cold season, last seen during 2022-2023. There have now been 37 days with a low of zero or colder, the most since the 2021-2022 season. The average number of below zero lows is 42.7. The three lows of -20 or colder were the first recorded since Jan. 26, 2022. That year had 5 lows of -20. The average number of -20 lows in a cold season is 5.4 days.
But this winter failed to produce
- Longer Consecutive Complete Day Streak Zero or Colder
- Three: Dec. 21-23, 2022
- Five (and 8 Days out of 10): Feb. 11-15, 2021
- Last high of -10 or colder: Jan. 6, 2014 (only 3 days since 1995)
- Last low of -30 or colder: Jan. 30 and 31, 2019
- Last lows of -40: Jan. 19 (MLK Jr Day), 1994; Feb. 2, 1996 (reached through NWS Twin Cities NOW Data; set to summarized data for a month)
- Any daily record cold temperatures for December, January, or February
- The only January temperature record broken was the January 30 record warm high (49, beating 44)
- Winter 2024-2025: 9 highs of at least 45 degrees, tied for the 9th most days
- 2 days with a high of at least 50 degrees
- 12 days with a high of at least 40 degrees
February Produces Half of Winter Snowfall
Storms were more frequent in early February than at any other time this winter. There were 9 days with at least measurable snowfall. The 5.5 inch snowfall on February 7-8 pushed St. Cloud's snow depth to 8 inches. February's St. Cloud State University snowfall (the official recording site for St. Cloud) climbed to 13.1 inches, 4.2 inches above average. That was the 23rd snowiest February out of 120 Februaries with snow records. Still, there have been only 22.1 inches of seasonal snowfall through the end of February, 4.9 inches below the 27.0 inch average.
During an average winter, St. Cloud has 86 straight days with at least an inch of snow cover and 104 days overall with an inch or more on the ground. Thanks to the late month thaws, February began with no snow cover. But snow fell during the first 3 days of February. This time, the snow lasted from February 2 through the 24th, only 23 days. That is the 8th fewest consecutive days with snow cover for a season. The fewest days in a row was in 1960-1961 (6 days in a row). St. Cloud did have snow as early as Halloween and has seen 57 days with at least an inch of snow so far. Last cold season produced the 8th lowest total on record (46 days), but the record was 19 days, set in 1958-1959. And, March (and sometime April) is usually part of the snow season. 2011-2012 was the last season without significant March snow (0.7 inch in March and April combined), while 2016-2017 had only 2 inches of March snow. Last year was not a snowless March as 18.3 inches fell, the 8th snowiest March on record. What will it take to produce major March snow? See the section on long-range forecasting below.
The melted precipitation in February was 0.83 inch, 0.07 inch above average. For the winter months, St. Cloud had 1.58 inch of precipitation, 0.73 inch below average. That's opposite of last winter, when a record December 2024 precipitation total of 3.35 inches led to the 5th wettest winter in St. Cloud records.
Will We Get Spring Drought Relief? (subtitled: You're Really Asking Me to Make a Long-Range Forecast?)
What Minnesota needs in meteorological spring is relief from the water shortfall that began in parts of northern and north central Minnesota during the spring and covered all of Minnesota since September (compare this week to September 3, 2024 version of the US Drought Monitor). While the snow season isn't over (St. Cloud sees on the average sees 11.3 inches from March on), we've already used up the water from the snow pack that fell during February. It melted mainly to the north and east of a Detroit Lakes-Brainerd line (see two week loop of continental US snow depth from NWS NORHSC). The water from that snowpack may have helped river and lake levels, but didn't get into the ground because of the deep frost depth (still more than 70 inches deep at the MnDOT site at Ottertail, MN and more than 40 inches deep at the MnDOT site at Otsego, MN). That's because the intense cold of December and January occurred without the usual snow pack, so the Minnesota DNR sites showed the deepest frost depth in late January since 2019. The National Weather Service frost depths sites remain 2-4 feet deep.
Streamflow Showing Temporary Boon from Snow Melt
This melting has temporarily pushed Minnesota river and stream levels to mostly average (light blue) with a few above average levels (green on the Minnesota DNR streamflow map) for all streams except a few red ones in the Boundary Waters). See also US Department of Agriculture streamflow stations (mostly green, meaning near average).
For the upcoming agricultural season, we need to thaw out the deeper than average soil frost, then get heavy rainfall. This would work most effectively before the greening of grasses and tree budding when the plant water usage is at a minimum. Usually, the most effective time to get major rainfall is during the middle and late fall after leaves turn and grasses brown.
Need to Break the Storm Track Pattern We've Seen Since the Fall
To accomplish this, we need a change in the dominant storm track pattern. As noted above, the winter and a good chunk of the fall either had Minnesota near the northern branch of a pair of storm tracks, with the southern storm track keeping the Gulf of Mexico moisture to itself, or a dominant northwest-to-southeast air flow pattern that brought dry polar and even arctic air at times from Yukon and the Northwest Territories. That flow pattern is typical of a cold season La Nina Pacific Ocean temperature anomaly (tropical Pacific Ocean temperatures colder than average; blue in the diagrams within the linked slide show from the NWS Climate Prediction Center). Minnesota didn't get extremely cold, except during the middle of each month, because there wasn't a constant supply of extremely cold air from the Arctic Ocean into Canada and, except for the mid-February outbreak, that cold to arctic air moved very quickly through Minnesota to the south and east, so we only had the mid-February cold period that lasted a while.
When these cold air masses pushed to the south of Minnesota, they moved the high moisture air well south into the Gulf of Mexico (on the afternoon of February 21, after the arctic air produced the -20 low in St. Cloud and moved on, the dew points, green numbers at lower left, didn't reach typical 60's until you got even with Cuba in the Gulf of Mexico). So, precipitation over the past 4 months has been sparse from northern and central Wisconsin (light green or even blue NWS National Water Prediction Service precipitation estimate to yesterday and last 120 days) westward to most of Wyoming and Montana away from the Rockies and the Bitterroot Ranges.
What Storm Track Changes Would Help
The change in steering winds has to produce either
- more west-to-east flow to allow the West Coast storms to retain middle and upper level moisture from the Pacific as they get into the Northern Plains
- or a split storm track with storms reforming in the Southern Plains tracking into Wisconsin so that Gulf of Mexico moisture can reach this far northward.
What Do the Long-Range Forecast Experts, a.k.a. 'True Believers,' Say and Why
The 'true believers' in long range forecasts, including those at NOAA's Climate Prediction Center, expect the weak La Nina conditions either to continue or fade this spring. The statistical link between the tropical Pacific circulation and weather impacts in the US are much weaker during the spring. There is a lot of 'light blue' in the Continental US spring temperature anomaly (upper left), tending towards a lot of the US being cold than average, but not much dark blue, which means the statistics aren't reliable trending towards cold (Nebraska to Illinois is only the orange shade in the upper right map, meaning only a 10-20 percent more reliable result than a coin flip). Also note that there are only 13 cases of La Nina years in the statistical model. It takes 30 years to set the 'current climate' conditions, so that could throw the statistics way off again.
For springtime La Nina precipitation, much of the southern two-thirds of the US is shown with drier than average conditions (see gray areas in the upper left) with some spotty reliability (dark orange or brown in the upper right). However, there are three sources of error in this comparison:
- Too few cases (17) to make a decent climatology.
- Rain is more often produced by thunderstorms during the spring, for which long range forecasts tend to be less accurate.
- We are coming off a weak La Nina which could dissipate during the March-May time period.
Still, the NWS CPC forecasters are going for a Minnesota spring without strong tendencies for either precipitation or temperature. They also have a slight tendency towards a drier than average Minnesota summer (with another hot summer forecast in the West and South), but by then, the La Nina will be gone and the thunderstorm tendency issue is large.
My Long-Range Forecast Is...(if you expect one, you haven't been reading my summaries over the years)
What do I think (see above)? Long-range forecast has the best history of being correct during the winter season, when the steering wind pattern tends to lock into one or two modes. During the spring and fall, the steering winds tend to jump around and don't always come back to the same pattern, so long-range forecasts are less accurate. During the summer, when very small systems with ample moisture can trigger large thunderstorm outbreaks, it is easy to be wrong, especially when you are along the fringe of the hottest, most humid air. That's where these CPC forecasts put us.
Since it takes much longer to change the temperature of the ocean than air (note that it takes much longer to generate boiling water or ice than it does to boil or freeze another substance), the overall departure of ocean temperatures from average can clue us in to the general global temperature trend. There are a few tropical ocean cold spots (blue) right now along the tropical Pacific Ocean (blame it on La Nina again) and off the western shores of the north Pacific and Atlantic, since that's where the cold air from Asia and North America first encounter water. Still, a lot of the world has warmer than average temperatures, which would tend to favor another warmer than average year globally. The cool spots mean it will be harder to continue to break the global temperature record this year than the past couple, but most of the world will likely be warm. Of course, none of this helps farmers trying to figure out what kind of a growing season Minnesota will have.
The only other conclusion I will offer is that the deep frost depth will mean a slow start to the growing season and possibly a slow progression of melting lake ice. It also means that any snow we could see in March won't necessarily be limited by warm ground, but we still have to see storms with sufficient moisture to produce a lot of precipitation.
|
Temperatures (°F)
|
Feb 2025
|
Normal
|
|
| Average High Temperature (°F) |
22.9
|
25.7
|
|
| Average Low Temperature (°F) |
1.7
|
6.5
|
|
| Mean Temperature for February (°F) |
12.3 (64th coldest February of 144 on record)
|
16.1
|
|
|
February Extremes
|
Temperature(°F)
|
Date
|
|
| Warmest High Temperature for Feb 2025 (°F) |
52
|
Feb 26
|
|
| Coldest High Temperature for Feb 2025 (°F) |
-4
|
Feb 17
|
|
| Warmest Low Temperature for Feb 2025 (°F) |
35 (set daily record; see below)
|
Feb 24
|
|
| Coldest Low Temperature for Feb 2025 (°F) |
-20
|
Feb 18
|
|
|
Record Temperatures in February 2025
|
Temperature(°F)
|
Date
|
Old Record
|
| No Temperature Records Set | February St. Cloud Record Temperatures | ||
|
Temperature Thresholds
|
Number of Days
|
Normal
|
|
| February 2025 Days with High Temperatures <= 32°F |
20
|
20.0
|
|
| February 2025 Days with High Temperatures <= 0°F |
1
|
0.8
|
|
| February 2025 Days with Low Temperatures <= 32°F |
26
|
27.8
|
|
| February 2025 Days with Low Temperatures <= 0°F |
16
|
12.2
|
|
| February 2025 Days with Low Temperatures <= -20°F |
1
|
2.9
|
|
|
Liquid Equivalent Precipitation (in)
|
Feb 2025
|
Normal
|
|
|
February 2025 Saint Cloud Airport Melted Precipitation (in)
|
0.83 inch
|
0.59
|
|
|
February Extremes
|
Precipitation (in)
|
Date
|
|
|
Most Daily Precipitation in February 2025
|
0.25 inch
|
Feb 8
|
|
|
Record Precipitation in February 2025
|
Precipitation (in)
|
Date
|
Old Record
|
| No Daily Precipitation Records Set | |||
|
Precipitation Thresholds
|
Number of Days
|
Normal
|
|
| February 2025 Days with Measurable (>= 0.01 inch) Precipitation |
9
|
5.7
|
|
| February 2025 Days with >= 0.10 inch Precipitation |
3
|
2.1
|
|
| February 2025 Days with >= 0.25 inch Precipitation |
1
|
0.8
|
|
| February 2025 Days with >= 0.50 inch Precipitation |
0
|
0.3
|
|
| February 2025 Days with >= 1.00 inch Precipitation |
0
|
0.0
|
|
|
Snowfall (in)
|
Feb. 2025
|
Normal
|
|
|
February 2025 Saint Cloud Airport Snowfall (in)
|
13.1 inches (23rd highest of 120 Febs)
|
8.9
|
|
|
Snowfall Thresholds
|
Number of Days
|
Normal
|
|
| February 2025 Days with Measurable (>= 0.1 inch) Snowfall |
7
|
5.7
|
|
| February 2025 Days with >= 1.0 inch Snowfall |
5
|
2.6
|
|
| February 2025 Days with >= 2.0 inch Snowfall |
2
|
1.4
|
|
| February 2025 Days with >= 5.0 inch Snowfall |
0
|
0.2
|
|
|
February Extremes
|
Snowfall (in)
|
Date
|
|
|
Most Daily Snowfall (in) in February 2025
|
4.3
|
Feb 8
|
|
|
Record Snowfall (in) in February 2025
|
Snowfall (in)
|
Date
|
Old Record
|
| No records set | |||
|
Temperatures (°F)
|
Winter 2024-2025
|
Normal
|
| Average High Temperature (°F) |
25.0
|
24.2
|
| Average Low Temperature (°F) |
6.3
|
5.3
|
| Mean Temperature for Winter (°F) |
15.6 (42nd mildest of 144 on record)
|
14.8
|
|
Winter Extremes
|
Temperature
|
Date
|
| Warmest High Temperature for Winter 2024-2025 (°F) |
52
|
Feb 26, 2025
|
| Coldest High Temperature for Winter 2024-2025 (°F) |
-9 (coldest since Jan. 6, 2014)
|
Jan 20, 2025
|
| Warmest Low Temperature for Winter 2024-2025 (°F) |
34
|
Dec 27, 2024
|
| Coldest Low Temperature for Winter 2024-2025 (°F) |
-27 (coldest since Jan. 7, 2022)
|
Jan 21, 2025
|
|
Temperature Thresholds
|
Number of Days
|
Normal
|
|
Cold Season 2024-2025 |
70
|
87.6
|
|
Cold Season 2024-2025 |
3 (most since 2022-2023)
|
4.3
|
|
Cold Season 2024-2025 |
0 (none since Jan. 6, 2014)
|
0.6
|
|
Cold Season 2024-2025 |
112
|
170.4
|
|
Cold Season 2024-2025 |
37 (most since 2021-2022)
|
42.7
|
|
Cold Season 2024-2025 |
3 (first since Jan. 26, 2022)
|
5.4
|
|
Cold Season 2024-2025 |
0 (none since Jan. 30 and 31, 2019)
|
0.6
|
|
Liquid Equivalent Precipitation (in)
|
Winter 2024-2025
|
Normal
|
|
Saint Cloud Winter Melted Precipitation (in)
|
1.58
|
2.31
|
|
Precipitation Thresholds
|
Number of Days
|
Normal
|
| Winter 2024-2025 Days with Measurable (>= 0.01 inch) Precipitation |
20
|
19.4
|
| Winter 2024-2025 Days with >= 0.10 inch Precipitation |
5
|
6.5
|
| Winter 2024-2025 Days with >= 0.25 inch Precipitation |
2
|
2.3
|
| Winter 2024-2025 Days with >= 0.50 inch Precipitation |
0
|
0.6
|
| Winter 2024-2025 Days with >= 1.00 inch Precipitation |
0
|
0.0
|
|
|
||
|
Snowfall (in)
|
Winter 2024-2025
|
Normal
|
|
Winter 2024-2025 Snowfall (in)
|
22.1
|
27.0
|
|
Seasonal Snowfall (in) for Cold Season 2024-2025 (October 1, 2024-February 28, 2025)
|
26.8 (54th lowest of 120 seasons)
|
34.9
|
|
Snowfall Thresholds
|
Number of Days
|
Normal
|
| Cold-Season 2024-2025 Days with Measurable Snowfall |
19
|
24.8
|
| Cold-Season 2024-2025 Days with >= 1.0 inch Snowfall |
9
|
10.6
|
| Cold-Season 2024-2025 Days with >= 2.0 inch Snowfall |
5
|
5.5
|
| Cold-Season 2024-2025 Days with >= 5.0 inch Snowfall |
0
|
1.0
|
|
Most Winter Highs >=40°F
|
Most Winter Highs >=45°F
|
Most Winter Highs >=50°F
|
||||||
| Rank | Cold-Season | Number of Days | Rank | Cold-Season | Number of Days | Rank | Cold-Season | Number of Days |
|
1
|
2023-2024
|
38
|
1
|
2023-2024
|
20
|
1
|
1939-1940
|
9
|
|
2
|
2001-2002
|
24
|
2
|
1980-1981
|
15
|
2
|
2023-2024
|
8
|
|
3
|
1923-1924
|
22
|
3
|
2001-2002
|
14
|
3 (tie)
|
1941-1942
|
6
|
|
4 (tie)
|
1913-1914
|
21
|
4
|
1930-1931
|
13
|
3 (tie)
|
1980-1981
|
6
|
|
4 (tie)
|
1930-1931
|
21
|
5
|
1939-1940
|
12
|
3 (tie)
|
2016-2017
|
6
|
|
4 (tie)
|
1980-1981
|
21
|
6
|
1990-1991
|
11
|
6 (tie)
|
1930-1931
|
5
|
|
4 (tie)
|
1986-1987
|
21
|
7 (tie)
|
1941-1942
|
10
|
6 (tie)
|
1999-2000
|
5
|
|
8
|
1998-1999
|
18
|
7 (tie)
|
1960-1961
|
10
|
8 (tie)
|
1907-1908
|
4
|
|
9 (tie)
|
1941-1942
|
17
|
9 (tie)
|
1899-1900
|
9
|
8 (tie)
|
1929-1930
|
4
|
|
9 (tie)
|
1960-1961
|
17
|
9 (tie)
|
1999-2000
|
9
|
10 (tie)
|
1904-1905
|
3
|
|
9 (tie)
|
1999-2000
|
17
|
9 (tie)
|
2024-2025
|
9
|
10 (tie)
|
1913-1914
|
3
|
|
12 (tie)
|
1943-1944
|
16
|
11 (tie)
|
1923-1924
|
8
|
10 (tie)
|
1920-1921
|
3
|
|
12 (tie)
|
1957-1958
|
16
|
11 (tie)
|
1986-1987
|
8
|
10 (tie)
|
1931-1932
|
3
|
|
12 (tie)
|
2011-2012
|
16
|
11 (tie)
|
2016-2017
|
8
|
10 (tie)
|
1957-1958
|
3
|
|
12 (tie)
|
2015-2016
|
16
|
14 (tie)
|
1901-1902
|
7
|
10 (tie)
|
1960-1961
|
3
|
|
14 (tie)
|
1913-1914
|
7
|
10 (tie)
|
1962-1963
|
3
|
|||
|
14 (tie)
|
1916-1917
|
7
|
10 (tie)
|
1990-1991
|
3
|
|||
|
14 (tie)
|
1917-1918
|
7
|
10 (tie)
|
1997-1998
|
3
|
|||
|
14 (tie)
|
1931-1932
|
7
|
10 (tie)
|
2001-2002
|
3
|
|||
|
14 (tie)
|
1957-1958
|
7
|
10 (tie)
|
2002-2003
|
3
|
|||
Updated March 2, 2025


Send comments to: raweisman@stcloudstate.edu