March 2025 Saint Cloud Weather Summary
2025 March St. Cloud, MN Weather Summary
Just Missed Top 10 Warm March
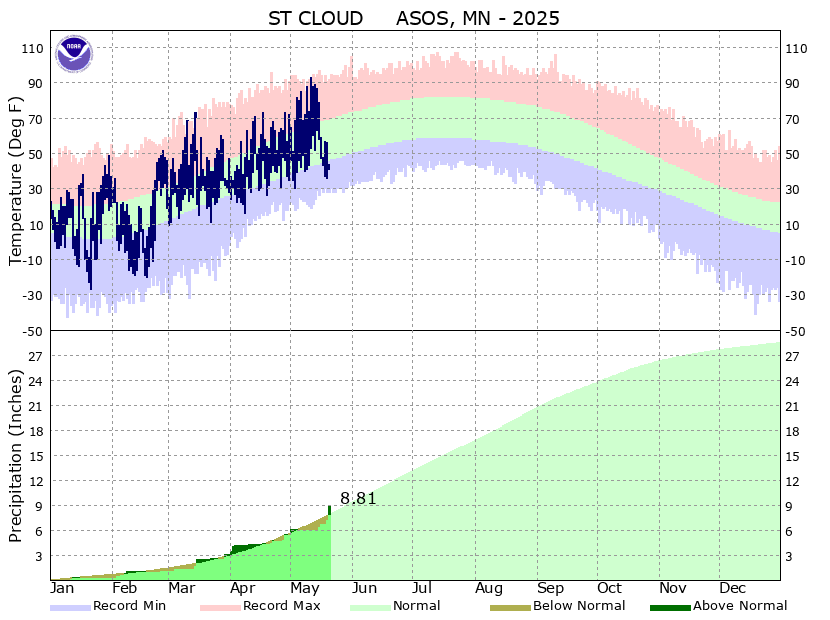
March 2025 broke the temperature regime of the winter months in St. Cloud Minnesota. The meteorological winter months (Dec 1-Feb 28) were defined by an ice cream sandwich of temperatures: a cold middle surrounded by milder weather early in the month, and near record warmth at the end of each month. But, March returned to nearly all mild all the time. The March average temperature at the St. Cloud Regional Airport was 35.9 degrees (average high: 47.4 degrees, average low: 24.4 degrees). This ended as the 13th mildest out of 145 Marches in St. Cloud temperature records. March was going at a pace that would have tied for the 10th mildest March, until three cool or near average days at the end of the month. St. Cloud had only 5 days with an average temperatures cooler than normal, two of which were during the last three days of month, and 7 days with a low temperature below average (bottom of blue line below green-blue transition).
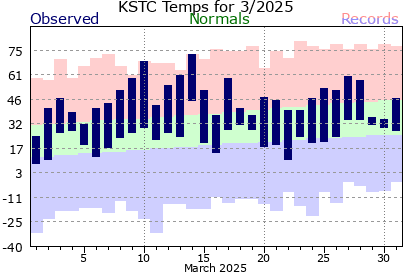
On the other hand, the St. Cloud Regional Airport set nearly as many warm temperature records as last March (2024: 6 record warm temperatures, including the 2nd and 3rd, and a tie for the earliest 60-degree high and a record for the earliest 70-degree high), mainly fueled by the warmth on March 10 (record warm high of 69) and 14 (record warm high of 73). St. Cloud had 2 other days with a high of at least 60 (March 13 and 27), but missed out on the incredible warmth of March 28 in southern Minnesota (see March Throws Nearly Every Type of Weather at Minnesota from the Minnesota Department of Natural Resources with more details below). In contrast to the daily warmth, St. Cloud only had two with a high of freezing or colder, on March 1 and 5. There have only been 7 previous Marches with 2 or fewer highs of 32 degrees or colder:
- 0 days: 1972-1973 2009-2010
- 1 day: 1909-1910 1941-1942
- 2 days: 1910-1911 1980-1981 2020-2021 2024-2025
The warm weather was produced by more frequent steering winds pushing down the east slopes of the Rockies and, at times, flow from the Central or Southern Plains. Because the winter and much of the spring had been so dry in the Plains and the eastern Rockies (less than 2 1/2 inches, light blue, when you set the NWS Water Prediction Service precipitation map to April 1 and the time period to 'year-to-date'), warm, but dry air easily developed to the south and moved over Minnesota. The lack of water vapor in the air meant that more sunshine was able to heat the ground during the day, but more heat was lost to space at night. There were several days with more than 30 degree temperature swings between high and low with a 39 degree spread on March 10. There were also short periods (2-3 days) when the temperature either rose or fell by at least 40, with March 14-16 producing a 50 degree swing (see 30-day graph of March St. Cloud temperatures from MesoWest).
Above Average March Precipitation Actually Helped Soil Moisture
However, March did produce a turnaround in the precipitation trend. Above average precipitation at the St. Cloud Regional Airport totalled 1.97 inches, 0.40 inch above average. That total offset to some degree the drier than average winter months (1.58 inches melted precipitation, -.73 inch). The November through March precipitation was greater in 2023-2024 with 6.35 inches (more than half in the record-breaking December 2023). This cold season's Nov-Mar precipitation total is 5.65 inches, still above the 5.00 inch 5-month average.
The March precipitation was produced in only 4 storms (excellent summaries by the Minnesota Department of Natural Resources, which are linked below to each event):
- 0.33 inch (0.9 inch of snow) March 4-5
- 1.02 inch (T snow) March 14-15
- 0.11 inch (T snow) March 22-23
- 0.51 inch (0.7 inch snow, 0.5 inch of ice) March 28-29
The March 14 and 15 case finally involved a large reservoir of air from the Gulf of Mexico as one of the procession of storms from the West Coast to the Texas Coast, then into the Ohio Valley, so thunderstorms developed. A slow-moving multiday storm at the end of the month produced the second wave of significant precipitation. It was significant in central Minnesota, because between a quarter and a half inch of ice accumulated from Alexandria, Little Falls, and St. Cloud through Princeton, Cambridge, and Pine City (see March Throws Nearly Every Type of Weather at Minnesota). The precipitation was important because the persistent warmth thawed the deep frost layer in the ground by mid-month in Otsego and is making progress at Ottertail. This meant that a lot of the precipitation during late March in southern and parts of central Minnesota was able to recharge ground water levels. Unfortunately, the March 14-15 storm, the largest event of the month, still was battling frozen ground, so a lot of the water ponded on top of the ground in the St. Cloud area, although it later had an opportunity to seep in.
More of this precipitation will be crucial, especially early in the spring, to offset the dry conditions from the fall and even part of the summer, from Minnesota south and west (see US Drought Monitor which includes precipitation only up to April 1). The end of March storm along with a major April 1-2 storm have produced more than 2 inches of liquid (yellow when you set the NWS Water Prediction Service precipitation map to April 3 and look at the 7 day total), despite much of it falling in frozen form (more on that later).
Snowless Cold Season Mostly Continued, Despite Pockets of Blizzard Conditions in Minnesota
Snowfall was mostly absent during March. St. Cloud State University only picked up 1.6 inches of March snow, 6.6 inches below average. This made March 2025 the 16th brownest March out of 120 in St. Cloud records. It was the least March snow since 2012 (0.7 inch). The 28.4 inches for the season through March 31 was 14.4 inches below average. During the first three of the 4 March precipitation events, there were narrow bands of heavy snowfall with even blizzard conditions in part of Minnesota (see Minnesota Department of Natural Resources summary of March 4-5 and the middle March events), but the limited moisture available kept the snow impacts rather small. The end of March storm (see March Throws Nearly Every Type of Weather at Minnesota) produced more winter impacts, but a layer of warm air aloft made much of the precipitation sleet and ice. St. Cloud State University had half an inch of ice from sleet and freezing rain, then 0.7 inch of snow.
However, the change of month produced some catch up during the April 1-2 snowstorm which was the widespread significant snowfall during the 2024-2025 cold season. That system produced 6.0 inches in St. Cloud, so the seasonal snowfall is now 34.4 inches, more than 2023-2024.
|
Temperatures (°F)
|
Mar 2025
|
Average
|
|
| Average High Temperature (°F) |
47.4
|
38.5
|
|
| Average Low Temperature (°F) |
24.4
|
19.8
|
|
| Mean Temperature for March (°F) |
35.9 (13th mildest Marches)
|
29.2
|
|
|
March Extremes
|
Temperature(°F)
|
Date
|
|
| Warmest High Temperature for March 2025 (°F) |
73 (set daily temperature record; see below)
|
March 14
|
|
| Coldest High Temperature for March 2025 (°F) |
25
|
March 1
|
|
| Warmest Low Temperature for March 2025 (°F) |
46
|
March 14
|
|
| Coldest Low Temperature for March 2025 (°F) |
9 |
March 1
|
|
|
Temperature(°F)
|
Date
|
Old Record
|
|
| Daily Record Warm Low |
46
|
March 14
|
45 in 2016
|
| Daily Record Warm High |
69
|
March 10
|
61 in 2015
|
|
73
|
March 14
|
71 in 2012
|
|
| Daily Record Warm Average |
50
|
March 10
|
46 in 2015
|
|
60
|
March 14
|
54 in 2012
|
|
|
Temperature Thresholds
|
Number of Days
|
Normal
|
|
| March 2025 Days with High Temperatures <= 32°F |
2 (tied for 5th fewest in March)
|
10.1
|
|
| Cold Season 2024-2025 Days with High Temperatures <= 32°F | 72 | 87.7 | |
| March 2025 Days with High Temperatures <= 0°F |
0
|
0.0
|
|
|
Cold-season 2024-2025 Days with High Temperatures <= 0°F |
3 |
4.3
|
|
| March 2025 Days with Low Temperatures <= 32°F |
28
|
28.0
|
|
|
Cold-season 2024-2025 Days with Low Temperatures <= 32°F |
140 |
155.4
|
|
| March 2025 Days with Low Temperatures <= 0°F |
0
|
3.5
|
|
|
Cold-season 2024-2025 Days with Low Temperatures <= 0°F |
37
|
42.7
|
|
| March 2025 Days with Low Temperatures <= -20°F |
0
|
0.0
|
|
|
Cold-season 2024-2025 Days with Low Temperatures <= -20°F |
3
|
5.4
|
|
| St. Cloud Historic -20°F Lows | Link to 10 Warmest/Coldest Marches | ||
|
Liquid Equivalent Precipitation (in)
|
March 2025
|
Normal
|
|
|
March 2025 Melted Precipitation (in)
|
1.97
|
1.57
|
|
|
March Extremes
|
Precipitation (in)
|
Date
|
|
|
Most Daily Precipitation in March 2025
|
0.74 inch
|
March 15
|
|
| Daily Precipitation Records |
Amount (inches)
|
Date
|
Old Record
|
| No records set | |||
|
Precipitation Thresholds
|
Number of Days
|
Normal
|
|
| March 2025 Days with Measurable (>= 0.01 inch) Precipitation |
8
|
7.1
|
|
| March 2025 Days with >= 0.10 inch Precipitation |
4
|
3.3
|
|
| March 2025 Days with >= 0.25 inch Precipitation |
4
|
1.8
|
|
| March 2025 Days with >= 0.50 inch Precipitation |
2
|
0.7
|
|
| March 2025 Days with >= 1.00 inch Precipitation |
0
|
0.1
|
|
| Link to 10 Wettest/Driest Marches | Complete list of Saint Cloud March Records | ||
|
Snowfall (in)
|
March 2025
|
Normal
|
|
|
March 2025 Saint Cloud Airport Snowfall (in)
|
1.6 (16th lowest March total)
|
8.2
|
|
|
2024-2025 Seasonal Snowfall (1 Oct 2024 - 31 March 2025)
|
28.4
|
43.1
|
|
| St. Cloud Single Storm Snowfalls | |||
|
Snowfall Thresholds
|
Number of Days
|
Average
|
|
| March 2025 Days with Measurable (>= 0.1 inch) Snowfall |
3
|
5.3
|
|
| 2024-2025 Cold Season Total Days with Measurable (>= 0.1 inch) Snowfall |
|
|
|
| March 2025 Days with >= 1.0 inch Snowfall |
0
|
2.8
|
|
| 2024-2025 Cold Season Total Days with >= 1.0 inch Snowfall |
9
|
14.0.
|
|
| March 2025 Days with >= 2.0 inch Snowfall |
0
|
1.5
|
|
| 2024-2025 Cold Season Total Days with >= 2.0 inch Snowfall |
5
|
7.6
|
|
| March 2025 Days with >= 5.0 inch Snowfall |
0
|
0.1
|
|
| 2024-2025 Cold Season Total Days with >= 5.0 inch Snowfall |
0
|
1.4
|
|
|
March Extremes
|
Snowfall (in)
|
Date
|
|
|
Most Daily Snowfall (in) in March 2025
|
0.7
|
March 30
|
|
| Daily Snowfall Records |
Amount (inches)
|
Date
|
Old Record
|
| No Records Set | |||
Last Updated: April 5, 2025
Send comments to: Bob Weisman


Send comments to: raweisman@stcloudstate.edu