November 2020 Saint Cloud Weather Summary
Warm and Wet Early November Produces Near Average Fall in Statistics Only
Saint Cloud Weather Summary for November 2020 and Fall 2020
Average temperature means the average high and low temperatures for a certain date. The average comes from the 30 years within the past 3 complete decades. So, we are still working with 1981-2020 data. But, that doesn't guarantee that any day actually has an average close to that average temperature. That is the story of Fall 2020 (1 September through 30 November) in St. Cloud.
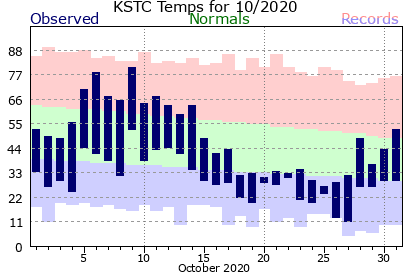
On the following set of charts (example: September) from the NWS in the Twin Cities, the St. Cloud average high temperature is where the green area meets the red area and the St. Cloud average low temperature is where the green area meets the blue area. The ends of the reds and the blues are the record high and low temperature for each day. During September, only 15 of the 30 days had an daily temperature within 5 degrees of average, and that was the month that ended up being the closest to normal (1.4 degrees colder than average)! In October, only 8 of 31 days were within 5 degrees of average with the monthly average being 5.7 degrees below normal. In November, the temperature has been within 5 degrees of average only 8 of 30 days. And, the monthly average was 5.6 degrees warmer than average. However, there were nearly equal swings both warmer and colder than average, so the average temperature for the entire three-month period was within half an degree of average, despite only 31 of the 91 days being within 5 degrees of average..
The most extreme period of each month broke records. September had a very warm start, but the period between September 8 and 10 produced 6 daily record cold temperatures, including 2 highs in the 50's, typical of the end of October. Another even more extreme period happened between October 17 and 27. Highs were as cold as the 30s and even 20s, typical of Thanksgiving or even early December, during this period. St. Cloud set or tied 6 record cold lows in 4 days.
On the other hand, the warm period in November between the third and ninth produced highs in the 60's and 70's, typical of September. There were 9 record daily warm temperatures set between the third and the eighth, including new November records for high temperature (76 on the 6th, breaking the old record of 75, set on November 8, 1999) and average temperature (64 on the 9th). The old record of 61, set on November 5, 2008 was tied on the 7th, then broken on the 8th and the 9th.
The ups and downs of November ended up producing an average temperature of 36.0 degrees, 5.6 degrees milder than average. That makes November 2020 the 15th mildest November out of the 139 Novembers in St. Cloud weather records. That was close to the rank in both Duluth (17th mildest) and International Falls (15th mildest).
The wild temperature swings in October and November brought snow during each of the cold periods. St. Cloud added another 8.0 inches in November, 7.2 inches in the storm on November 10. The 15.8 inches through November 30 is 6.2 inches above average. This produced another 8 days of snow cover, adding to the 8 October days of snow cover and the 7.8 total inches of snow. Even though there is no snow on the ground in St. Cloud or much of Minnesota as of December 2, the 16 days with at least an inch of snow cover is among the earliest in St. Cloud records. However, melting that snow is typical as the average period of 86 straight days with at least an inch of snow cover begins around December 10. While the October 20 storm did set a snow record for St. Cloud, the November 10 storm fell well short of the November 10 snowfall record (13.2 inches in 2014).
The storm of November 9 and 10 ended up dumping 2.03 inches of precipitation during the two days, but that failed to break the daily precipitation records. That storm nearby doubled the average precipitation (1.38 inches) for the entire month of November, but the main storm track then pushed well to our south and east for most of the rest of the month, so only 2.27 inches fell in total. November 2020 ended up as the 20th wettest November out of 127 in St. Cloud records. The November 9-10 storm along with the October 11 rainstorm that broke a daily precipitation record (1.11 inch) and a rainstorm on September 24 (1.13 inch) ended up producing the vast majority of the fall precipitation. The three storms produced 4.27 inches of the fall total of 6.42 inches. The total was still 0.91 inch below average. For the year, St. Cloud is less than an inch below average with 26.21 inches (-0.70 inch).
|
Temperatures (°F)
|
November 2020
|
Normal
|
|
| November Average High Temperature (°F) |
45.9
|
39.0
|
|
| November Average Low Temperature (°F) |
26.0
|
21.7
|
|
| Mean Temperature for November (°F) |
36.0
|
30.4
|
|
|
November Extremes
|
Temperature(°F)
|
Date
|
|
| Warmest High Temperature for November 2020 (°F) |
76 (broke daily and November record warm high; see below)
|
November 6
|
|
| Coldest High Temperature for November 2020 (°F) |
28
|
November 12
|
|
| Warmest Low Temperature for November 2020 (°F) |
57
|
November 8
|
|
| Coldest Low Temperature for November 2020 (°F) |
4
|
November 13
|
|
| Record Temperatures in November 2020 |
Temperature(°F)
|
Date
|
Old Record
|
| Daily Record Warm High |
74 (tie)
|
November 3
|
set in 1978
|
|
75
|
November 4
|
72 set in 1975
|
|
|
76
|
November 6
|
70 set in 1916, 2001
|
|
|
69
|
November 7
|
68 set in 1949
|
|
| Daily Record Warm Average |
61
|
November 6
|
60 set in 1906
|
|
63
|
November 7
|
54 set in 2016
|
|
|
64
|
November 8
|
60 set in 2006
|
|
| Daily Record Warm Low |
57
|
November 7
|
46 set in 1977, 2016
|
|
57
|
November 8
|
47 set in 2006
|
|
| November Record Warm High |
76
|
November 6
|
75 set on November 8, 1999
|
| November Record Warm Average |
64
|
November 8
|
61 set on November 5, 2008
|
|
Temperature Thresholds
|
Number of Days
|
Normal
|
|
| November 2020 Days with High Temperatures <= 32°F |
4
|
9.9
|
|
| November 2020 Days with Low Temperatures <= 32°F |
25
|
25.7
|
|
| November 2020 Days with Low Temperatures <= 0°F |
0
|
1.5
|
|
|
Precipitation (in)
|
November 2020
|
Normal
|
|
|
November 2020 Precipitation (in)
|
2.27
|
1.38
|
|
|
2020 Total Precipitation (in)
|
26.21 (-0.70 from average)
|
26.91
|
|
|
Precipitation Thresholds
|
Number of Days
|
Normal
|
|
| November 2020 Days with Measurable (>= 0.01 inch) Precipitation |
6
|
6.6
|
|
| November 2020 Days with >= 0.10 inch Precipitation |
3
|
3.0
|
|
| November 2020 Days with >= 0.25 inch Precipitation |
2
|
1.5
|
|
| November 2020 Days with >= 0.50 inch Precipitation |
2
|
0.7
|
|
| November 2020 Days with >= 1.00 inch Precipitation |
1
|
0.2
|
|
|
November Extremes
|
Precipitation (in)
|
Date
|
|
|
Most Daily Precipitation in November 2020
|
1.44 inch
|
November 9
|
|
|
Record Precipitation in November 2019
|
Precipitation (in)
|
Date
|
Old Record
|
| Daily Record Precipitation |
0.47 inch
|
November 30
|
0.37 inch in 2015
|
|
Snowfall (in)
|
November 2020
|
Normal
|
|
|
November 2020 St. Cloud Snowfall (in)
|
8.0
|
8.9
|
|
|
2020-2021 St. Cloud State University Snowfall (1 Oct 2020 - 30 Nov 2020)
|
15.8
|
9.6
|
|
|
Snowfall Thresholds
|
Number of Days
|
Normal
|
|
| November 2020 Days with Measurable (>= 0.1 inch) Snowfall |
5
|
5.7
|
|
| November 2020 Days with >= 1.0 inch Snowfall |
1
|
2.6
|
|
| November 2020 Days with >= 2.0 inch Snowfall |
1
|
1.5
|
|
| November 2020 Days with >= 5.0 inch Snowfall |
1
|
0.5
|
|
|
November Extremes
|
Snowfall (in)
|
Date
|
|
|
Most St. Cloud Daily Snowfall in November 2020
|
7.2 inches
|
November 10
|
|
|
Record Snowfall in November 2020
|
Snowfall (in)
|
Date
|
Old Record
|
| No records set | |||
|
|
|||
|
Temperatures (°F)
|
Fall 2020
|
Normal
|
| Average Fall High Temperature (°F) |
54.6
|
55.3
|
| Average Fall Low Temperature (°F) |
34.2
|
34.5
|
| Mean Temperature for Fall (°F) |
44.4
|
44.9
|
|
|
||
|
Liquid Equivalent Precipitation (in)
|
Fall 2020
|
Normal
|
|
Fall Precipitation (in)
|
7.33
|
|
|
Snowfall (in)
|
Fall 2020
|
Normal
|
|
2020 Fall Snowfall (1 Oct 2020 - 30 Nov 2020)
|
15.8
|
9.6
|
| 2020 Calendar Year Snowfall (1 Jan 2020-30 Nov 2020) |
37.3
|
34.5
|


Send comments to: raweisman@stcloudstate.edu